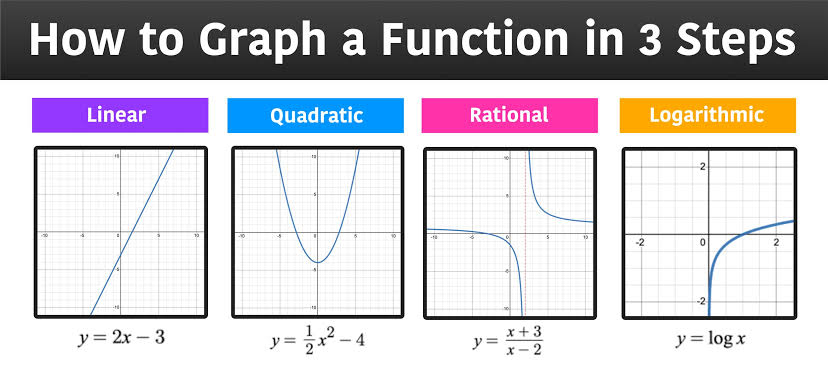
Functions can be graphed on a coordinate plane where the x-axis represents the input (domain) and the y-axis represents the output (range). For example, the function f(x)=x² would be represented as a parabola opening upwards.